
Analysis is an interesting line of work. Crunch the data, mash it up, and see what falls out. Then: test, test, test. Once I’m sure I’ve got an important story to tell, the hard work begins: convincing with integrity.
“Integrity” means more than “being honest.” Honesty is necessary for integrity, but integrity is more than simply telling the truth.
According to the Oxford English Dictionary [1. The Compact Edition of the Oxford English Dictionary Book Club Associates, 1979, vol 1.], here’s the earliest written use of the word “integrity” in its modern sense:
“Not y’sacrifice, nor oblacion, whych to the integretie thereof requyreth both the formes.” — More, Poysoned Booke, 1533.
Believe it or not, this is ‘Early Modern English’. I translate: As long as you haven’t thrown away any part or tampered with it, (whatever it is) its required integrity is maintained.
The definition provided for “integrity” is “the condition of having no element or part taken away or wanting; undivided or unbroken”.
Wholeness, in other words.
In analysis, we can say that integrity is maintained by: “keeping the means in line with the aim.”[2. Tukey, J. W. (Ed.) Exploratory Data Analysis Addison-Wesley, 1977.] Ask, ask, ask again: Where are we going with this? What scale needs our attention? Are we exploring or confirming? Seeking insight or support? Are we looking at big differences, or tiny details that might be important?
What Are We Trying to Achieve Here? – Integrity in the case of Argon
I love “Exploratory Data Analysis” by Tukey [3. Tukey, J. W. (Ed.) Exploratory Data Analysis Addison-Wesley, 1977.]. It’s a great statistics book written for non-statisticians. Tukey presents a lot of ideas that are helpful and in short supply. He includes a case study of Lord Rayleigh’s data analysis of nitrogen, where mysterious results were found.
Rayleigh wrote in the journal “Nature” in 1892:
“I am much puzzled by some recent results as to the density of nitrogen, and shall be obliged if any of your chemical readers can offer suggestions as to the cause.” [4. Rayleigh, Nature vol 46, 512–513 (1892)]
Rayleigh was investigating nitrogen: the colourless, odourless gas that makes up most of our atmosphere (79%). I remember how surprised I was when high school chemistry taught me how little of our air is oxygen. “Most of what I push in and out of my lungs has no use to me? How odd.”
Rayleigh’s research used nitrogen from two different sources; one from air that had all the oxygen reacted out, and one from a chemical reaction that produced pure nitrogen. He found that samples of nitrogen obtained from air were ever-so-slightly heavier than chemically produced nitrogen. He also felt that “margin of error” did not account for it. Weird.
Well, was it a big difference? Let’s have a look (click to embiggen).
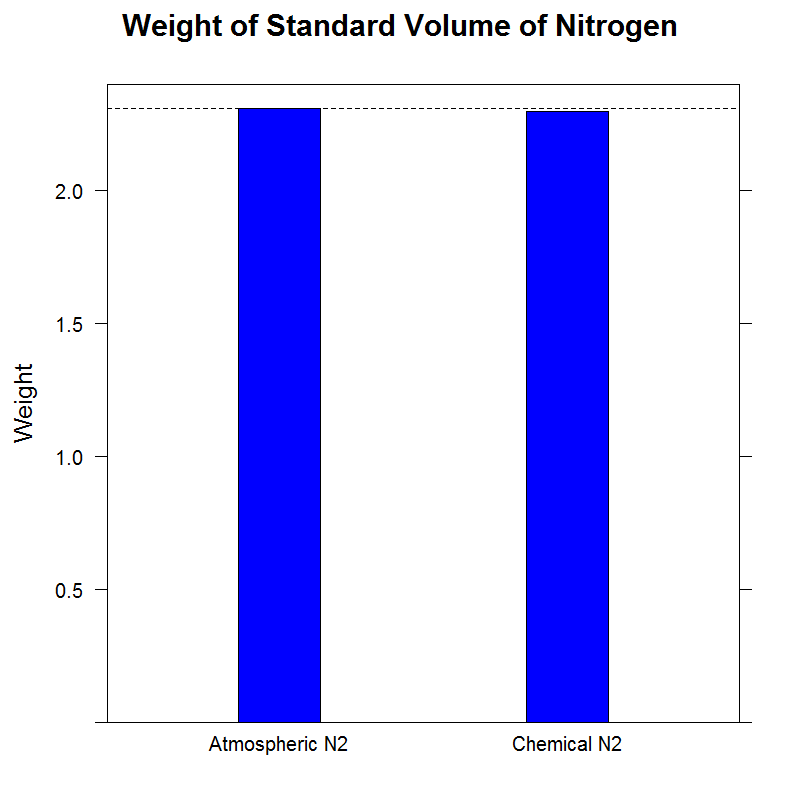
No. It was a really really small difference. Less than half percent. A big number if you’re talking about your mortgage. Less so if you’re weighing, say grapes. Or air.
Did it matter?
That depends.
If Rayleigh was in the business of selling pure nitrogen, and promised at least, say, 98% purity, it would make no difference whatsoever. He would be right to ignore the difference.
Rayleigh was an experimental chemist, at a time when knowledge was expanding rapidly. There was a lot of unknown stuff. Lots of that unknown stuff lurked in little corners like this. Turn over a rock and you were bound to find something new.
So, looking for something new: here’s the same data, with the scale zoomed in.

The difference is argon – an unknown gas at the time, and about 1% of what you’re breathing right now. It’s colourless, odourless, and nobody has ever made it react chemically with anything. [5. It belongs to a then-unknown group of gasses, called either the “inert gasses”, or the “noble gasses”, depending on how poetical you’re feeling.]
The first graph is useful if you’re not troubled by small differences. If your aim is to test whether there is a practical difference where we get nitrogen from, this graph is the right one.
Graphs are at their most helpful when they give a mental shortcut to analysis, without unnecessary diversion.
The second graph also shows there is no practical difference (as far as most of us would be concerned), but this is not the first impression your eyes give. If a picture is included to tell a thousand words, the second graph’s words emphasize “difference”, not “similarity”. Your first impression might be “Crikey, are these even the same gas?”. You have to look at the scale and think carefully to spot the “no practical difference”. After a bit of thought, you might say: “Oh, that difference is actually less than one percent, now that I look closely.”
But the difference certainly appears statistically significant; that is, reliably different enough that you can detect it amongst the noise.
Graphs are at their most helpful when they give a mental shortcut to analysis, without unnecessary diversion.
The second graph is in fact the basis for Rayleigh’s Nobel Prize in 1904 (Chemistry). It shows a small difference that is very important if you’re looking for unknown things in the air. The unknown thing in this case was Argon, and its discovery re-wrote much of what we knew about chemistry.
Again: integrity means keeping the means in line with the aims (with honesty, of course). One chart above shows the scale of the difference, the other shows the detail.
Leave A Comment